
Divyalakshmi Rajamanickam
Data Analyst
Data Analyst
An aspiring data analyst skilled in gathering and processing data for client-centric solutions.
I’m Divya, an aspiring Data Analyst with a background in Engineering. My interest in data analysis stems from my detail-oriented nature and my love for storytelling. I have completed the data analytics program at Thinkful. My specialties are data visualization, Tableau, SQL, Python, Microsoft Excel, & Power BI.I love finding answers by analyzing and visualizing data. I enjoy storytelling with data.
I believe that my experience as an Application Developer Trainee set me to transform into a highly adaptable, flexible, detail-oriented professional. I am comfortable working in fast-paced, diverse environments and I easily assimilate into different company cultures. I embrace teamwork but also enjoy working independently.
On my website you can find some examples of my projects, most of them are links to a website or interactive visualization.
Have fun in browsing through the content and thank you for visiting!
Produced and presented professional projects and presentations from concept to completion focused on business forecasting, price modeling, and statistical analysis.
Developed skill in data analytics systems including Pandas, Excel, PostgreSQL, Tableau and Python, as well as methodologies including dashboarding, performance tracking, data wrangling, cleaning, and analysis.
Extensively used Core Java concepts like OOPS & Exception Handling. Used JDBC to establish database connectivity. Developed SQL queries to perform CRUD operation in Database.
Collaborated with other developers on group projects and established a project workflow using GitHub.
Learned and applied Full Stack Development skills in HTML, CSS, SQL, Javascript & Java.
<Bachelor of Engineering in Electricals & Electronics (GPA:3.5)
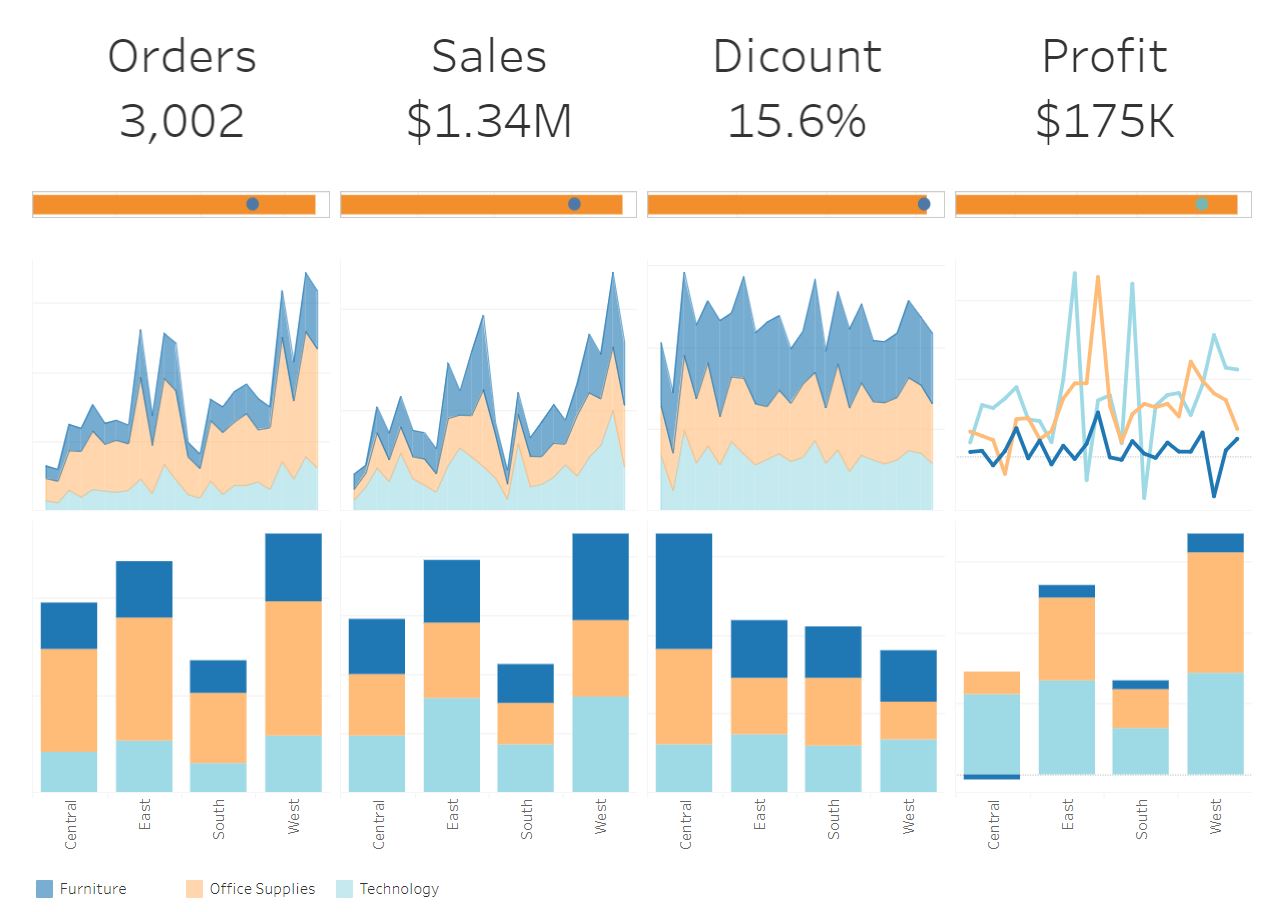
I built this Tableau Dashboard which shows the KPIs of stores in the Midwest. While this was one of my projects from my time at Thinkful.
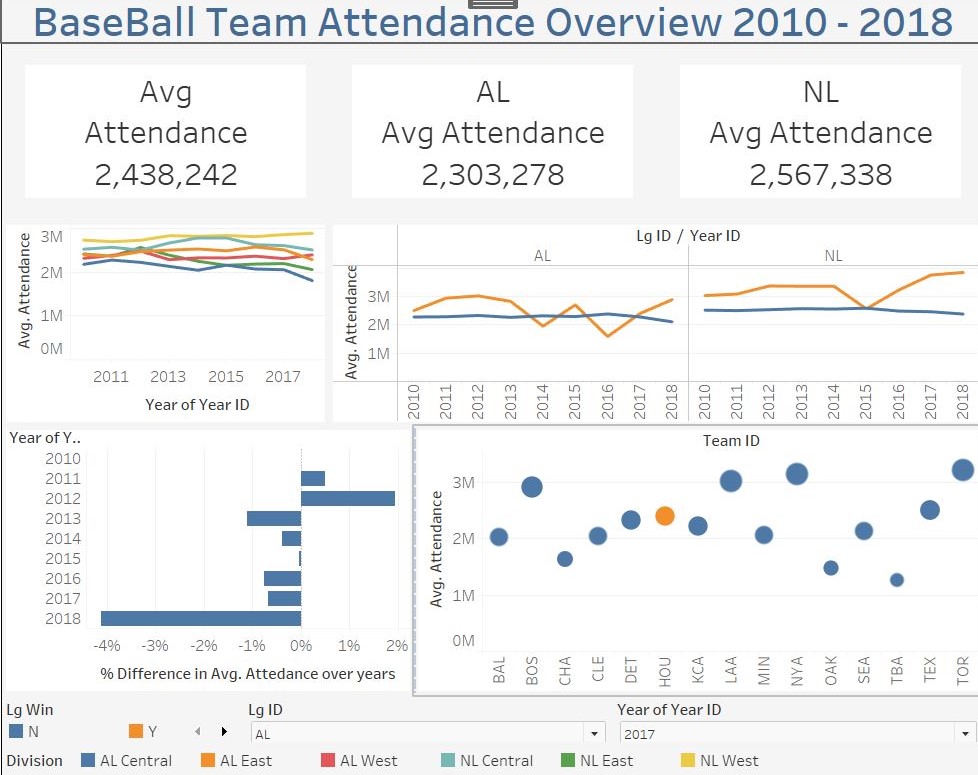
Built a dashboard to monitor and explore the trend of Major League Baseball attendance which has been dropping for years.
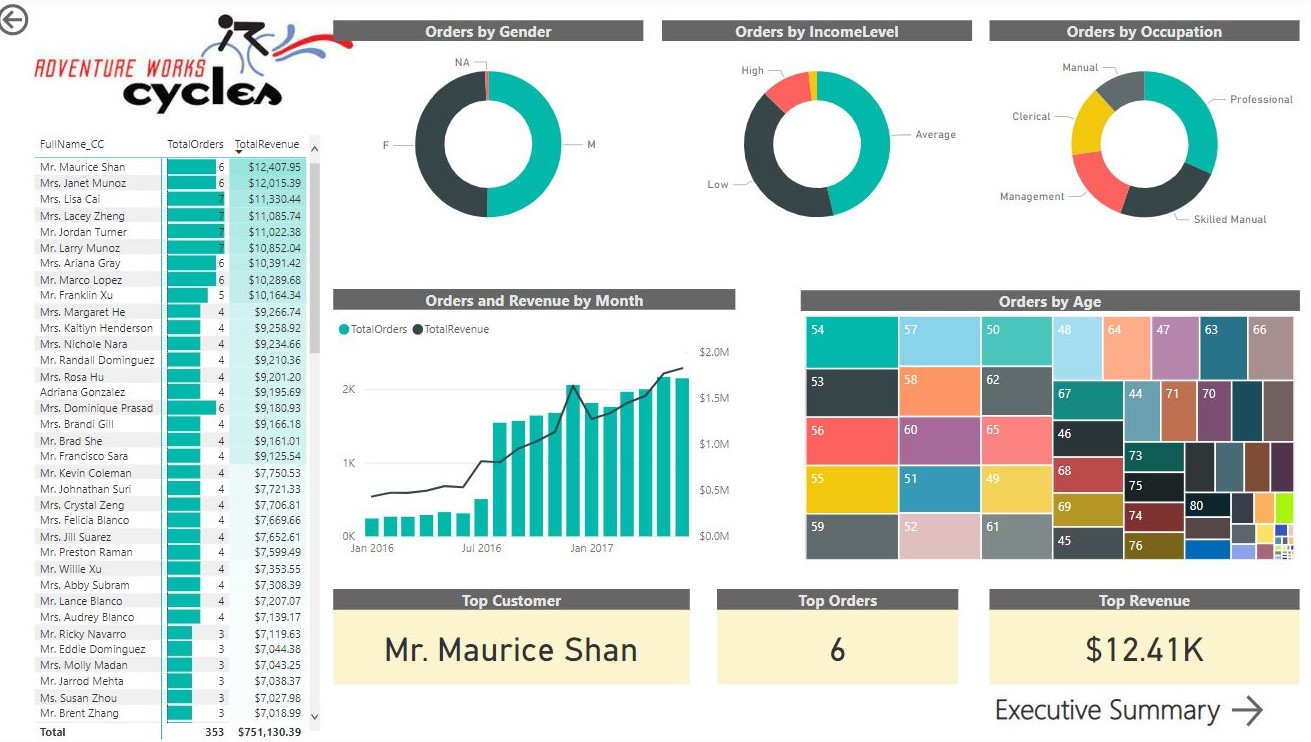
Designed and delivered an end-to-end business intelligence solution, armed only with Power BI and handful of raw csv files.

Created a cost and revenue dashboards that allowed users to see the effects of manipulating location and rental fleet size to optimize total revenue.Model built using Excel
Conducted a statistical analysis of house prices to determine which variables had a correlation on driving up house prices. Analyzed with A/B testing in Excel and presented with powerpoint.
Conducted a statistical analysis of Customer Personality to determine which customer segment is most likely to buy a product. Analyzed with A/B testing and visualizations in Python using Pandas and presented with powerpoint.
 ">
">